The Spec III Update for Gran Turismo releases tomorrow, and one of the most interesting features being added is the Data Logger. A couple of the previous games had a feature similar to this one, but the version in Gran Turismo 7 is the most in-depth version of it to date.
The Data Logger is a tool used in real motorsports to analyze the car's performance as it drives along the track, and compare your line on a specific lap to another time to see exactly how the other time drives and use this information to improve your lap times.
The feature is a bit complicated at first, but the folks over on the Gran Turismo website have provided a very useful example for you.
Quote From Polyphony Digital The Spec III update introduces the new 'Data Logger' feature. This tool creates a visual representation of your driving data for you to go back and analyse, just like in real motorsports. In this guide we will provide some examples of how you can use the Data Logger in case it's your first time.
But why use the Data Logger? By studying your data, you can find ways to improve and become a better driver. For this purpose, you should start by comparing two sets of data, instead of just analysing one alone. You can load your personal best laps, or even download replay data from the fastest players in the online rankings. Compare your data with an example, then look for differences and improvements. That's all there is to the basics of the Data Logger.
Let's take a look at two examples of this.
■ Compare and Improve Driving Techniques
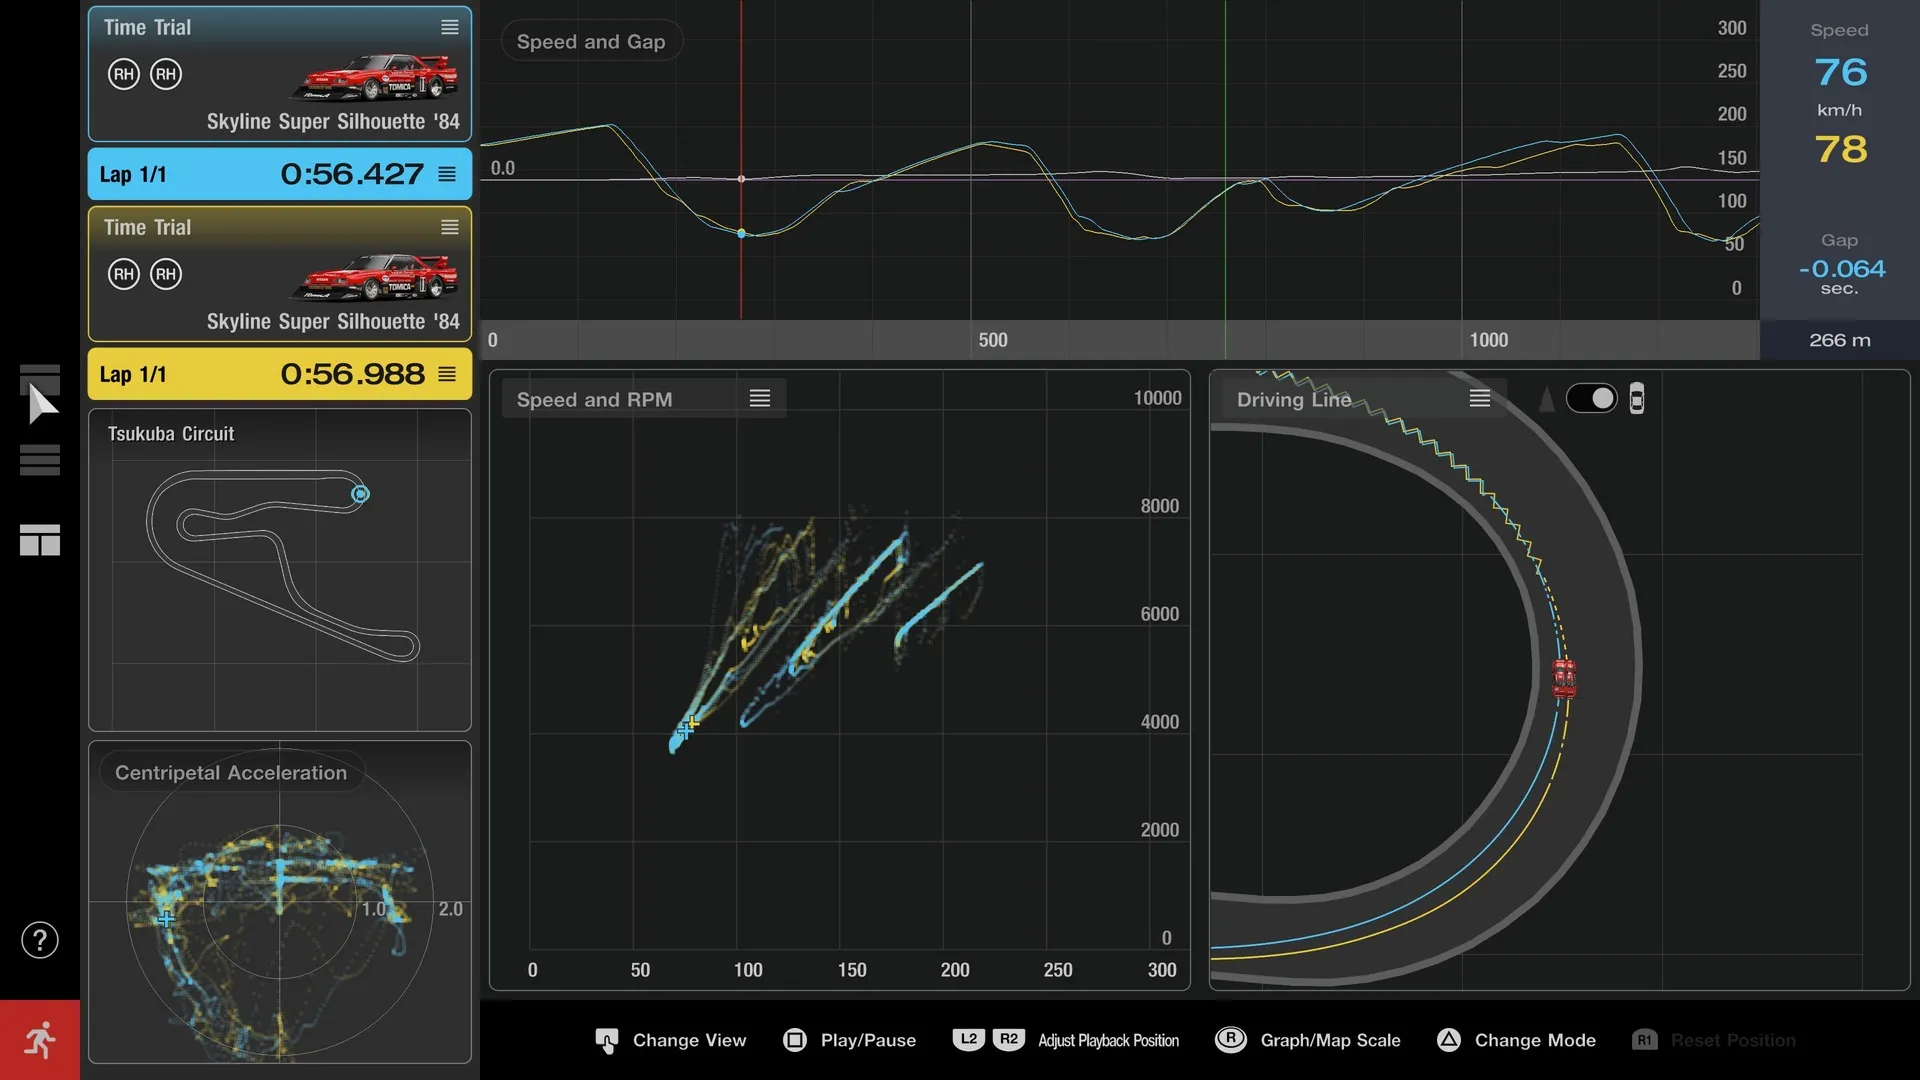
What's the difference between a fast driver and a slow driver? In this example we'll look at a comparison of two drivers using the same car on Turn 1 at Tsukuba Circuit, and try to find some ways to improve.
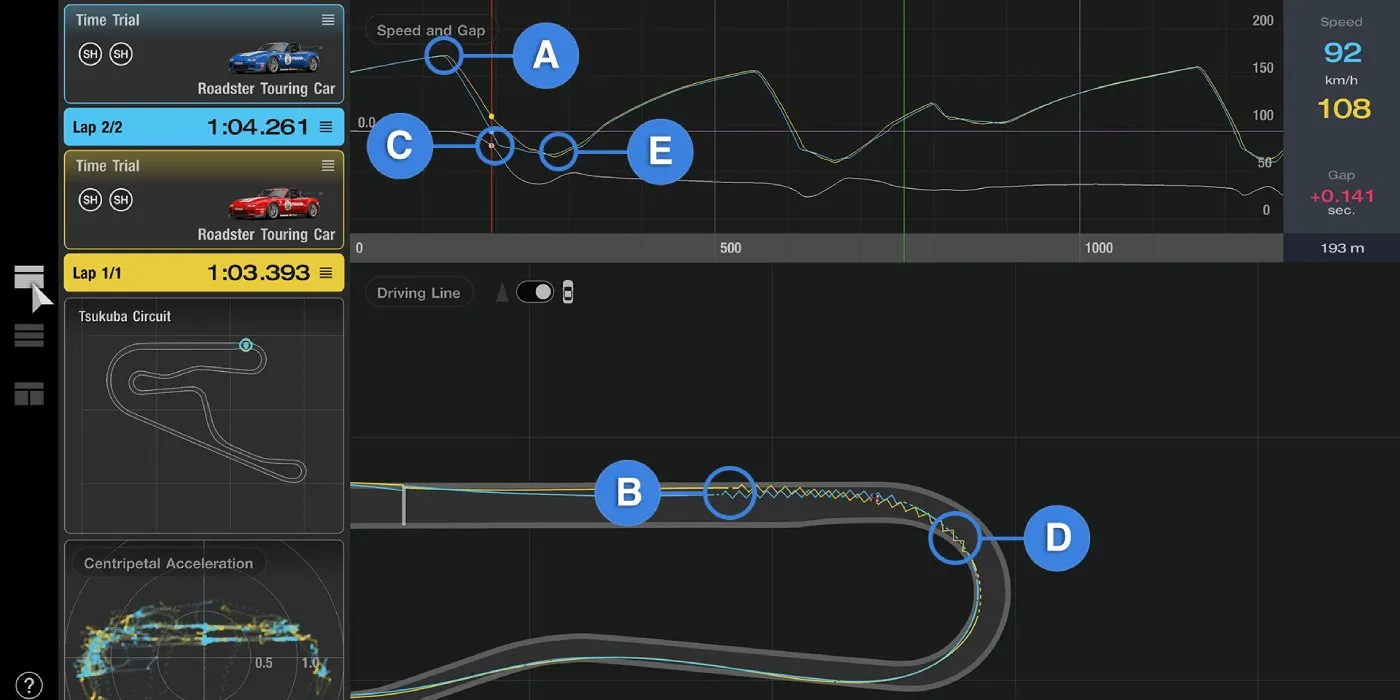
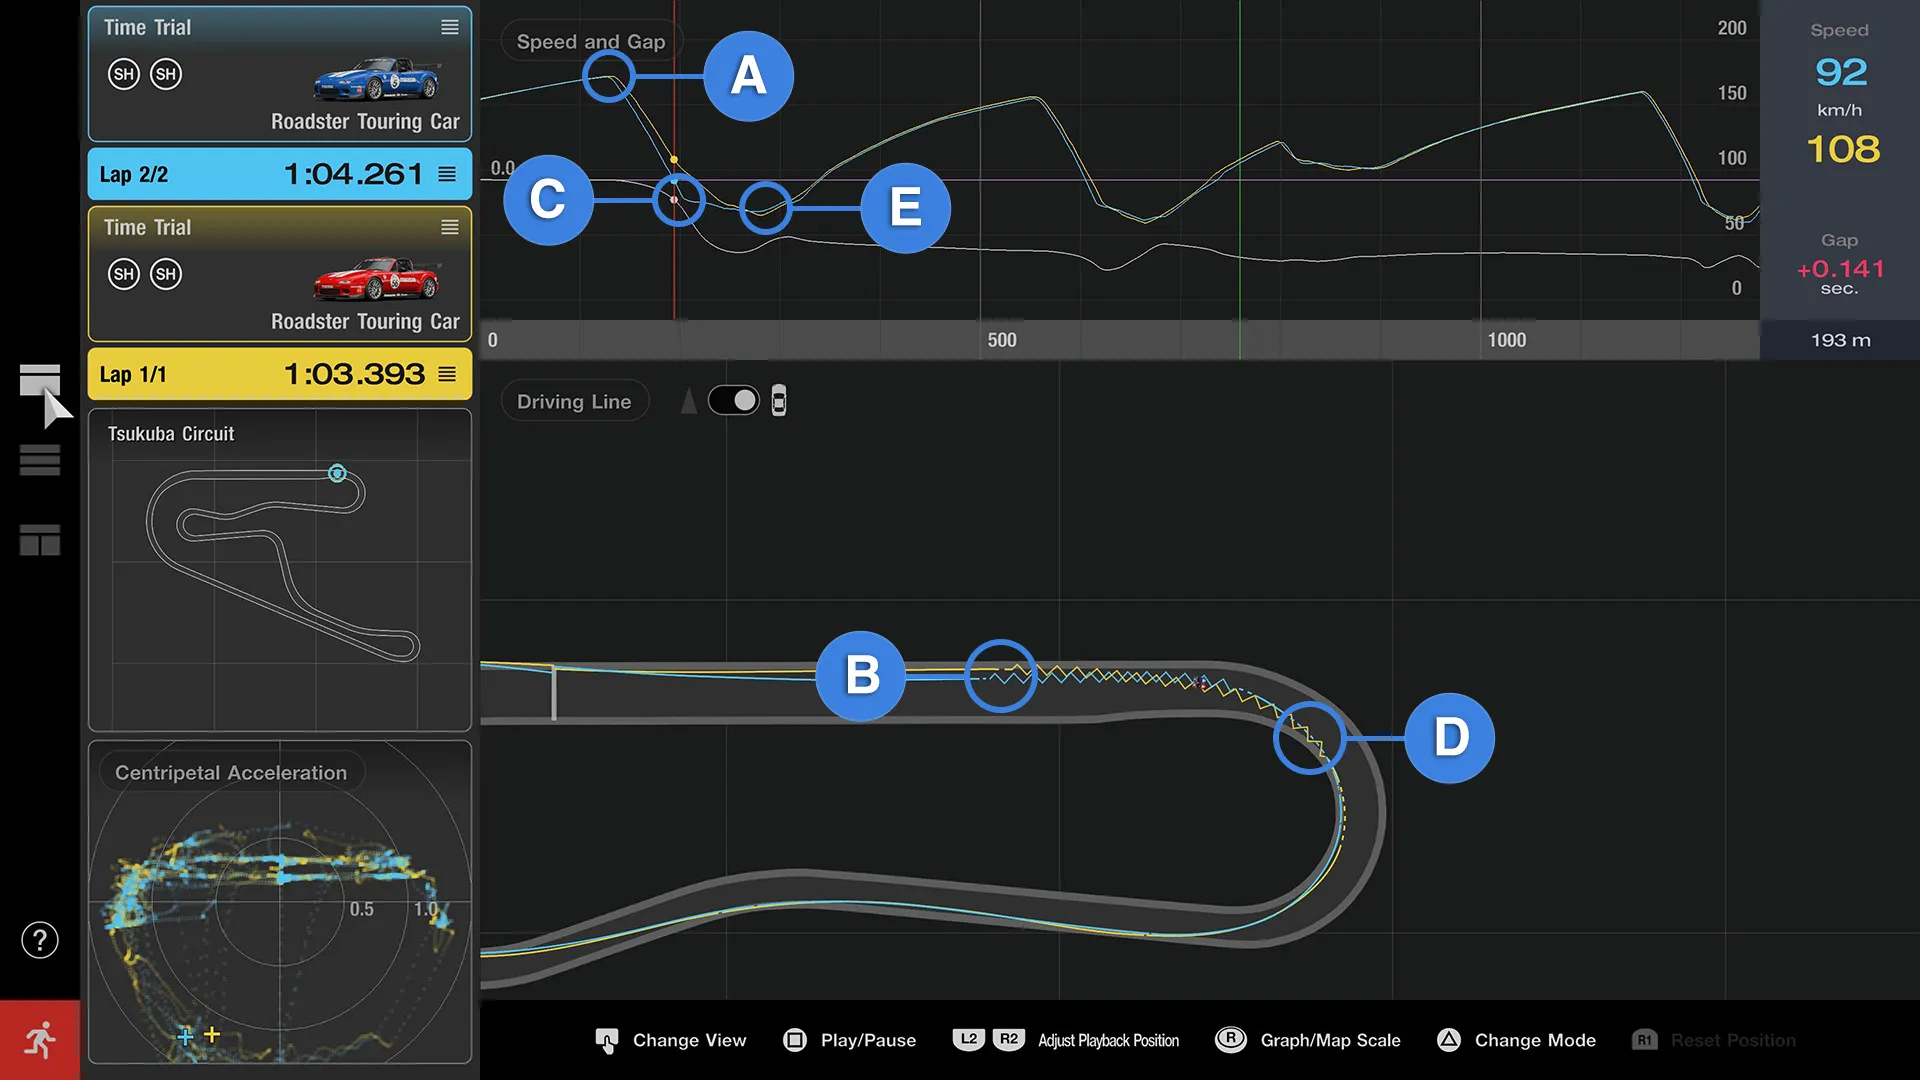
Here we'll compare the blue and yellow lines, where the blue line has a slower time. Comparing the 'Speed and Gap' graph lines and the 'Driving Line' plots of each car, there are a number of points to note. You can see that while both cars reached the same top speed on the home straight (point A), the blue car started braking first (B). That meant the blue car's speed dropped too low on corner entry (C), so they were unable to accelerate until the corner exit, relying on momentum to push them through the apex (D).
Meanwhile, the yellow car continued steadily braking through the corner entry. So while they had a lower bottom speed (E), they were able to steadily increase their speed through the corner exit.
This is just a single corner, but the time difference on exiting the corner has already grown to half a second. From the data presented, we can see that the blue car can improve their time by braking later, reducing the length of time spent neither braking nor accelerating.
By comparing driving data in the Data Logger like this, it's easy to see where and why time differences happens. Analyse faster drivers and try copying their techniques for a shortcut to racing success.
■ Compare and Improve Car Settings
The Data Logger is also great for tuning your car settings. Let's change cars and look at the same corner again, Turn 1 at Tsukuba Circuit.
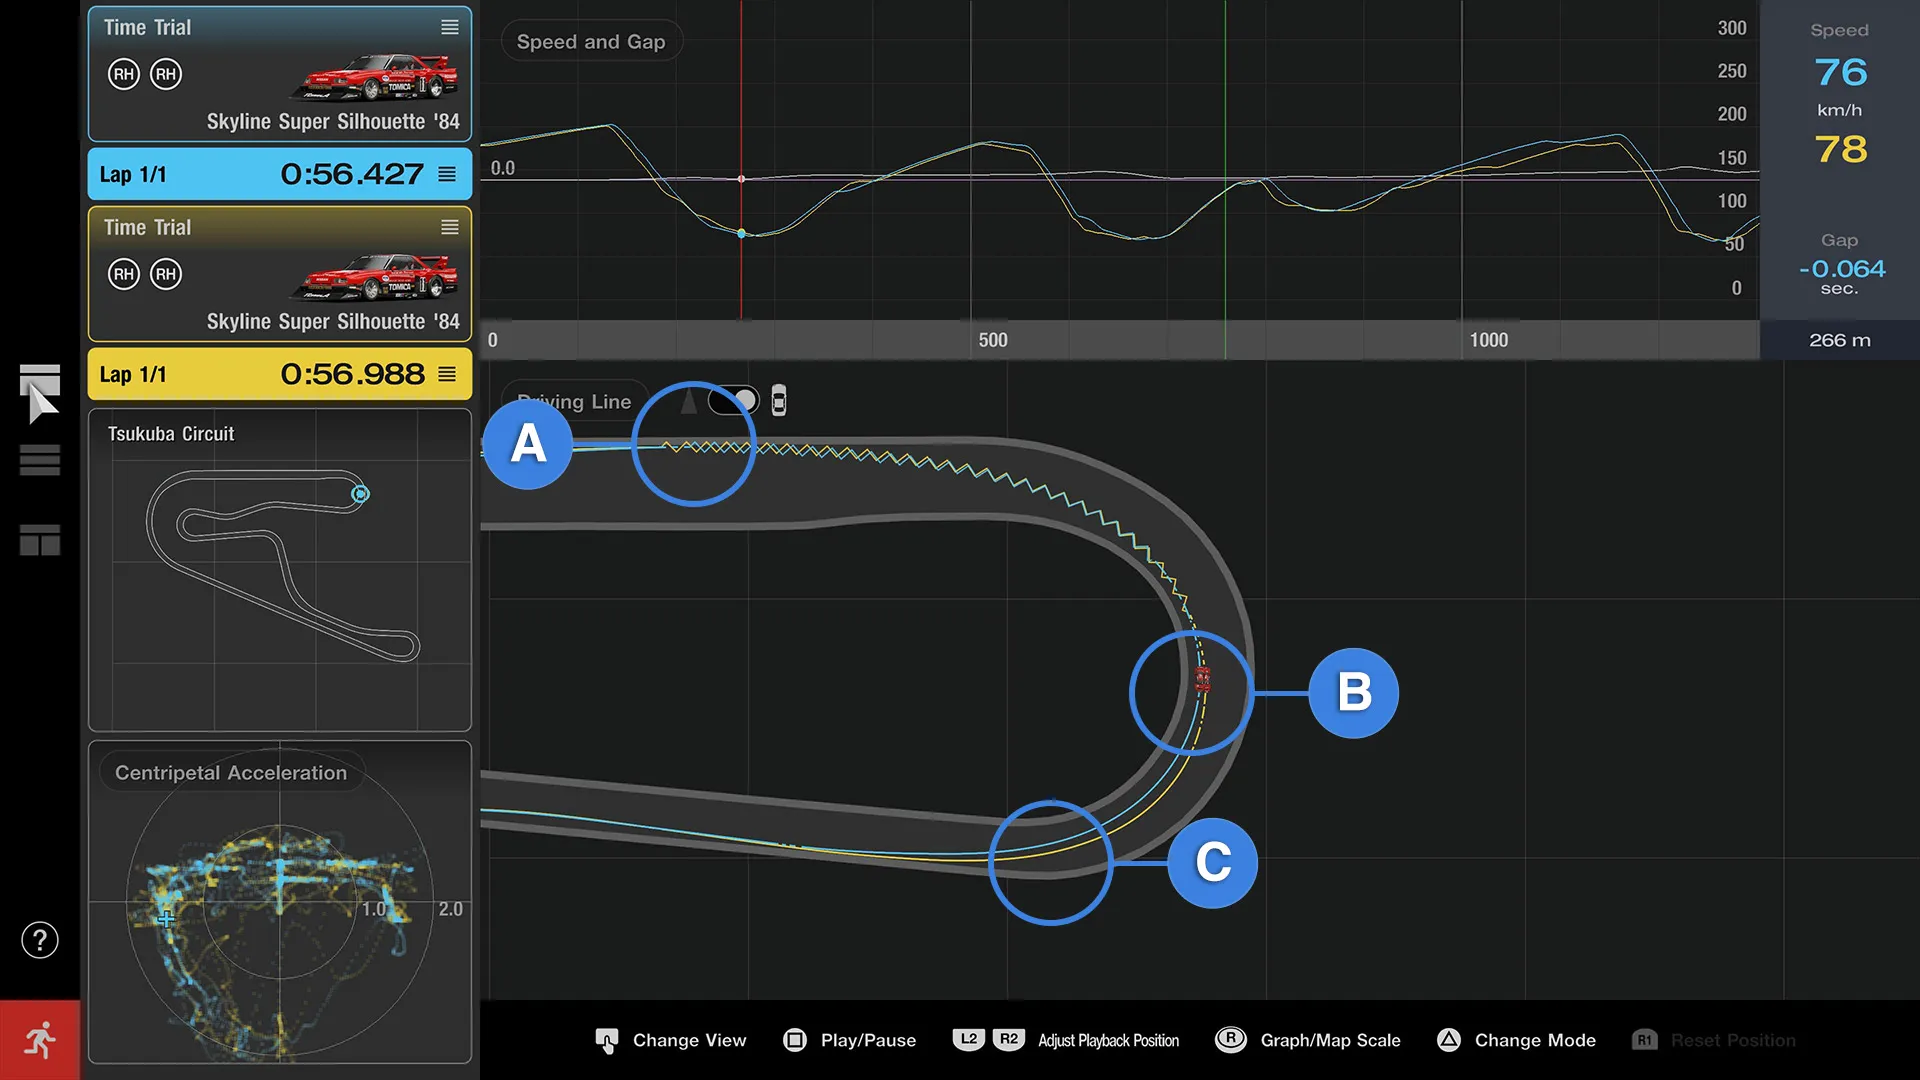
The yellow car is on default settings. The blue car has increased downforce on the front (meaning more weight on the front wheels). Take a look at the blue car: while it started braking later than yellow (A), the blue car was able to turn in without any understeer. This is because the extra downforce on the front improved its cornering ability. Also, we can see that the blue car increased throttle and started accelerating earlier than yellow (B). On the corner exit, the yellow car struggles with understeer, pushing out their line, while the blue car was able to take the turn more tightly (C). The gap between the two on the corner exit is 0.3s.
From this data, we can see than even on a low-speed corner like Tsukuba's Turn 1, increasing downforce has a relatively large effect. The car used in this test has an innate tendency to understeer, but as we can see, on tracks with lots of tight corners like Tsukuba Circuit, increasing the front downforce will improve cornering and shorten times.
With the Data Logger, you don't have to tune by feeling. The data is all there to see so you can find what works and what improvements could be made. In this example, we increased the front downforce, but could you get the same effect if you just decreased the rear downforce? Try it out and see what the Data Logger can do for your setups.
These are just two ways to use the Data Logger, but you can also use it to compare two different cars on the same track, or compare data from different tyre types.
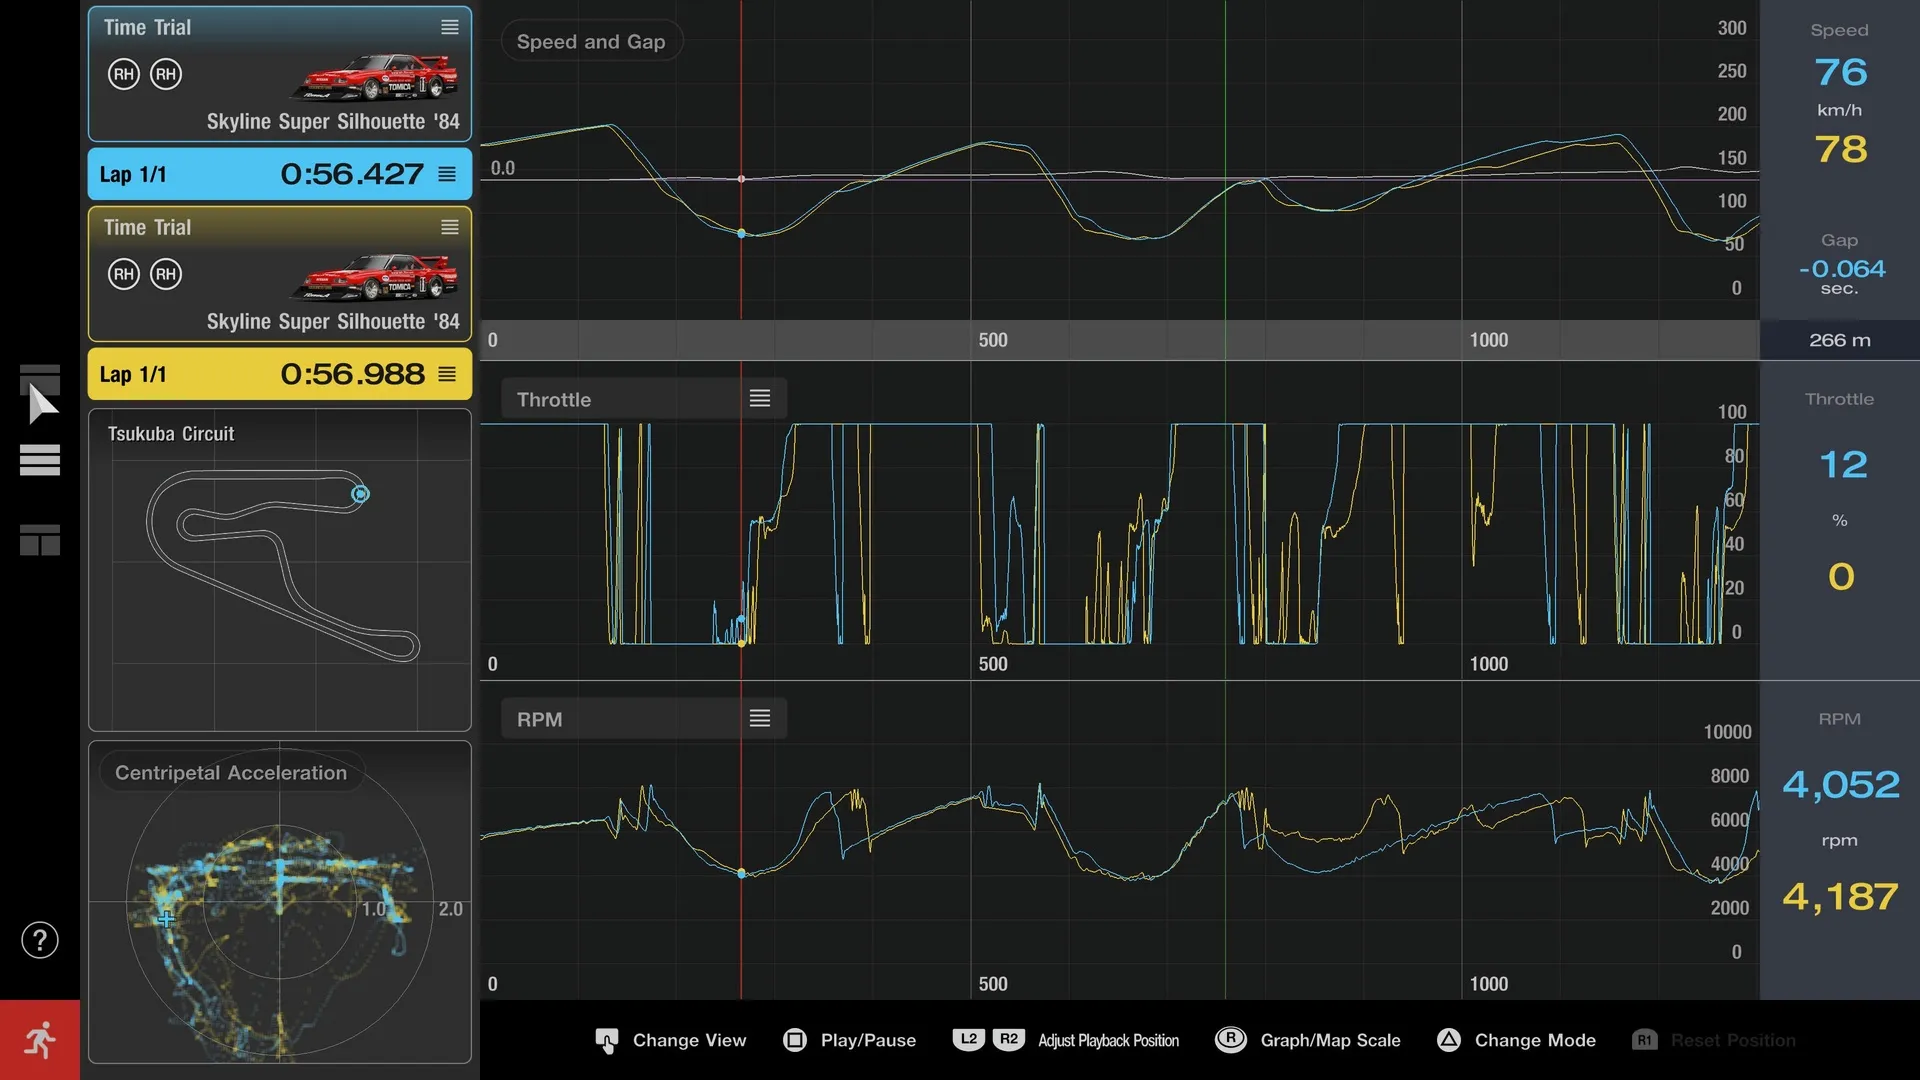
The examples above use 'View 1,' but there are other ways to view data as well. 'View 2' lets you see inputs like throttle and brake next to lateral Gs and other information, while 'View 3' is focused on data like speed and engine RPM. There's lots of data to explore and analyse, so be sure to take a look.
View 2 View 3
What do you think of the new Data Logger feature? Let us know your thoughts in the comments below.

Leave a Comment