Hey all,
If you've been trying to access the site over the past few days, you've likely encountered several errors, and sometimes for prolonged periods of time. This is not at all normal behaviour and I'm feeling very confident at this point that we've resolved them and the site is the fastest it has ever been. I'll explain what's been going on.
But first, a couple of weeks ago:
Roughly two weeks ago, the site was offline for around a full day due to a software issue. An incorrect OS install on all four of our dedicated servers meant that when they rebooted, they didn't want to come back. I was able to make temporary modifications to bring them back but other issues arose during this that I didn't feel comfortable. Since the site had already been offline for many hours at this point, I reinstalled everything on our stack starting with the application servers. This is quite a process and during it I tightened things up so that we had better recreation of servers in the future via automation scripts so its easy to tear down and rebuild our hardware. This was previously semi-done, but for one reason or another it wasn't perfect.
Moving on to this past week:
We've had to scale down the hardware for the site. With declining traffic and revenue from advertisements, it has not been affordable to keeping the site up on our previous hardware. I've personally taken this cost on a monthly basis for several years but I just couldn't do it anymore, something had to happen so on Oct 6, a migration started to hardware that I own instead of rent.
The hardware in question is not as good as the previous stuff. Our previous rollout was entirely overspecced for what we needed but it was done so we had room to grow without having to worry about scaling and we could do so at 17% of the cost of previous cloud-based setups. Cloud computing is truly the world's worst enemy and although it makes for a good strategy when you need scalability on-demand, everyone should really use dedicated hardware for their baseline computing needs for massive economic savings.
I installed our software stack, had everything running, and things were looking good. DNS was switched over, and as soon as we started getting live load traffic (which includes so many bots scraping the site, including Google and Bing) we ran out of resources and the crash loop began.

The way the website application has been optimized.. well it's not. From years of having overspecced hardware, little care was taken to making sure that everything is able to run as fast as possible as efficiently as possible. I have, over the years, fixed a good chunk of performance issues to increase our speeds, but not enough was done for running on 1/4 of our previous resources, especially under non-synthetic loads.
The past, almost week now, I've been optimizing everything as much as possible to get the best possible experience out of the site and I'm happy to report that through this, we're running the fastest we ever have and I'm not done. We have more places we can optimize our database queries to really reduce load across the board.
Speaking of, we were in a scenario where the site came online, traffic overwhelmed it, our pods couldn't handle the amount of traffic we were getting hit by so they went unresponsive, the database went to shit and locked itself up, and then the pods kept recreating themselves which caused even more strain on everything. It was a set of cascading failures!
Profiling the database side of things to see which our Postgres instance was having trouble keeping up with the application, showed an interesting set of queries that were locking up connections.


Hearthstone cards are one of the most commonly accessed pieces of data on the site, and when we fetch a Hearthstone card from the database, we also typically run a query to get card mechanics. This is all automatic and .... an 11 second query for a couple dozen cards and their mechanics does not feel right.
So, lets take a look at what's happening.
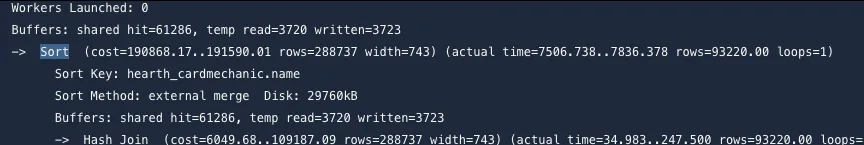
Oh. God. The database was trying to order 93,000 rows of data, by the mechanic name, and it wasn't able to fit the sort into memory so it had to resort to using the harddrive to finish the sort. Disk I/O is less performant than RAM I/O, so if you can avoid hitting the disk, you're winning hard. But, that's not the entire 11 seconds of time, we've also got the hash join taking up ~200ms to build and filter the results which is incredible slow. We must be missing an index...
Which we were! Due to an oversight, mechanics in the database never received an index by Name DESC for sorting purposes. This is a trivial fix, so let's go ahead and add in an index and benchmark the query again.
While looking at the table though, something looked off.
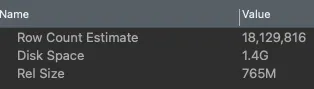
How in the world is this table 1.4GB in size and why are there 18 million rows of data? This table is very simple, it stores the relationships between a card and its keywords. It looks like this:
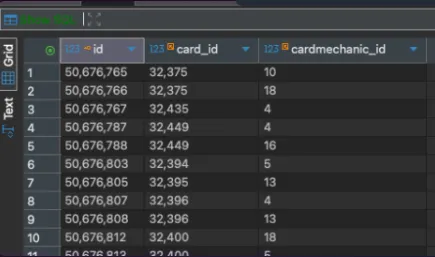
Hearthstone has 32k card objects in the game, all of which exist in our database. The most amount of keywords a card has is 6, though some of ours are flagged with 10 for some reason which is an entirely different issue, and having that many keywords is a rarity. But let's assume the worst case scenario, every card in the game has 6 keywords. That give us at most 192k records in the database. How do we have 18 million?
Clearly, our code has a bug somewhere. If you've been around for card reveal seasons, you know that we typically encounter problems with the site during them, a fact Nirast had brought up on Slack the other day. He's correct, we always have problems during card reveal season and I usually scale up the application a bit more and find a creative new way to improve performance somewhere, just not where I should have been looking. Let's investigate how many mechanics these cards have.
SELECT card_id, COUNT(*) AS mechanic_count
FROM hearth_card_mechanics
GROUP BY card_id
HAVING COUNT(*) > 10
ORDER BY mechanic_count DESC
LIMIT 100;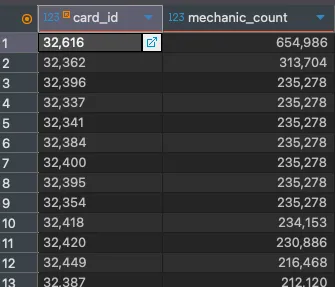
Holy- what? How does a single card have 654,986 mechanics? Titanographer Osk, what's wrong?
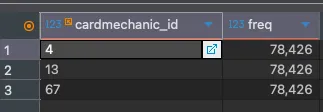
Oh, he doesn't. He just has 78,426 copies of three different mechanics. I immediately knew the issue was with our card data importer and it was time to deduplicate the data. A temporary table and a couple of queries later, the data was deduplicated, the original table was rebuilt, and some more indexes were added to our cards and keywords tables to speed things up. Now, we're sitting at 13k relationships.

By no means is it perfect on the card database, but it's damn fast compared to the 11 seconds we were getting before. What was happening was during the 11 seconds it would take for the card database to return results, kubernetes was detecting no traffic from the pod that was serving the page and so it was killing it to bring it up again. This fixed that problem but things still weren't right.
Now, this wasn't all just a software issue, there was a hardware issue as well. One of the nodes has had a CPU failure. During the first couple of days, our primary node was failing intermittently. Logs did not prove to be very useful but you could sometimes catch an error that was pointing towards an issue with our CPU power states. I was able to make some changes to prevent certain states from happening, I underclocked the processor, and I started turning off other hardware features we did not need. This resulted in an 11 hour uptime which looked promising, but as soon as I looked away from it, we ended in a cycle of a dozen crashes over half an hour.
Day 3, which was Oct 9, I moved our main node onto a separate piece of hardware, the second one in the mix. We saw more stability because this has zero hardware issues but we weren't able to deploy immediately because... GitHub was down! GitHub is where we compile our containers and deploy to our infrastructure and with them down to a botched deploy, we were sitting around and waiting. I could have run things more manually, but it was important that as few things changed at a time to ensure the things we know that work (like our build and deployment processes) would continue to have our backs.

When they came back, so did we (briefly) but it wasn't over yet, more things needed to be optimized. We were sitting with the server filled with memory with no room for breathing. More code updates went out, primarily on the caching side to find more places to cache data since retrieving data from the cache is quite a bit faster than the database (we primarily cache HTML which also means we don't have to build the markup from queries, saving on cpu time in addition to query time) and progress was being made there. Until, a mistake was made with the way realm threads were being cached on the homepage.
You see, I accidentally cached a 40 MB query into our Valkey instance. Now, Valkey (a fork of Redis) is an incredible piece of software that makes caching data trivial. You can also use it as a database but we employ it specifically as a caching service as it is faster than Memcached. 40 MB of data in a single key isn't a large problem for Valkey to handle, but it is a problem for Python to handle. When Python retrieves data from Valkey, it unpickles it. When the unpickle operation is happening, our worker process for the website becomes stuck for the duration of the unpickle. Having a process running in the pod, if we get unlucky, a pod could go through several of these unpickle operations in a row with how common the hompage is to get visited, which means our container is thought to be offline when the application health-check doesn't go off and then the container gets shut down and doesn't respond to the user's homepage request and then that container is out for a moment while the application loads back up.
Initially though in my fixes, I didn't try and fix the underlying problem of a 40MB cache value. I've gotten a minimal amount of sleep over the past week because if I'm sleeping, things aren't being fixed. My brain went to "we must compress this data" thinking this was entirely Valkey's fault - we've already established this was a Python unpickle issue - so reconfiguring the connection to Valkey, we are now storing larger caches of data with Zlib compression. Of course, that made no difference.
Stepping back and going through the code flow again, the problem became obvious that the caching code was the culprit. The entire queryset that generates our pagination for the homepage threads was being cached which was not the goal. So, now we manually cache the templated markup instead of queries and the frontpage has never been faster.
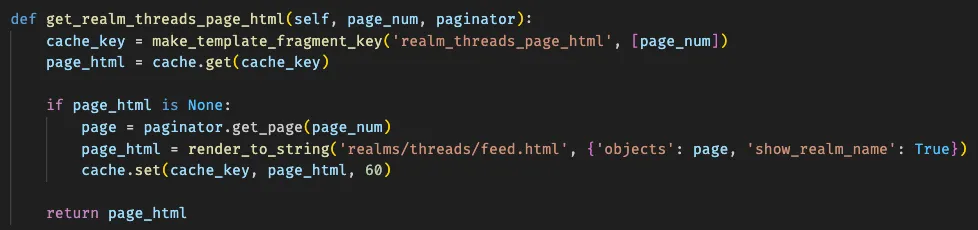
The whole reason the front page even received a change to how the realm threads were being cached was due to me wanted to get rid of one extra query on the database. The database was still getting hit for pagination even though the page itself already had the data cached which, that's silly to do. This will eventually be improved to where we permanently cache the thread block on the homepage, and recalculate the first page of results anytime we have new thread activity. This will keep the load experience more consistent for everyone instead of every 60 seconds someone gets to bear the slightly increased load time while it recomputes.
There have been several other optimizations made to add cache to queries that are experienced site-wide which has helped improve our page performance across the board. There are still a few more places I want to employ additional caching, but those will be solved with some time. For now, my priority is to restore all of our Hearthstone-focused things because reveal season has been rocky so far but the team has. been doing well to keep everyone up to date on card reveals as often as the website has allowed it.
My apologies for the downtime. We are currently running quite smooth though on 1/8 of the hardware that we previously had access to, which shows how bloated everything was. The goal is to acquire some extra hardware though over the coming weeks to deploy it out and it will give us some extra room to play with.
Oh and since this is a retrospective let's go over the lessons learned:
- Performance debt builds quietly when your hardware specs hide inefficiencies.
- Index audits need to be a part of every major update to our database.
- Don't optimize things when you're deprived of sleep. Not that I had much of an option here, downtime is bad.
Next steps forward:
- Finish more caching on the website to further speed things up.
- Deploy better query monitoring solutions to more easily see slow queries (we are currently logging them).
- Expand to one additional node on our kubernetes cluster within the next few weeks.
- Hoping to add two total additional nodes by end of year.
- Reduce memory footprint of pods as much as possible to keep things lean. Less memory usage = we can serve more traffic since our workload is primarily memory-bound at the moment.
Comments
Huge slew on new card reveal threads bumped this down, but I'm bringing it back up because I think it's quite important that you all know what happened.